Charts can be amazing indicators of future performance because of the natural ebb and flow of the market; more specifically a “trading range,” which is what we now so often see.
If you can navigate these channels correctly, there is money to be made.
Lets’ take a look at couple:
DECKERS OUTDOOR (DECK)
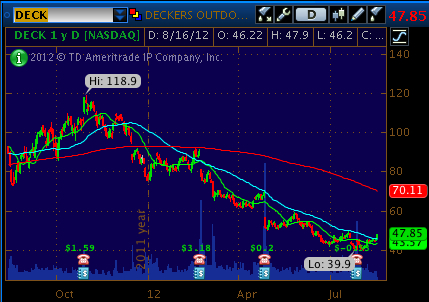
This chart indicates that DECK is down nearly 60% from its 52 week high of $118.90 reached on 10.31.11. Since then, the stock has come all the way down to a recent low of $40.23, where it has found support. In late January, the 50 day moving average crossed the 200 day, in what is referred to as “the Death Cross,” a bearish indicator.

If you look at the stock today, moving forward, we could argue the stock has bottomed off of the $40 dollar level and if it can climb above its 50 day average, DECK could move up to its 200 day, which currently sits at $70.81However, if the stock breaks below its recent support ($40) it’s going be a “lookout below” situation.
STARBUCKS CORP (SBUX)
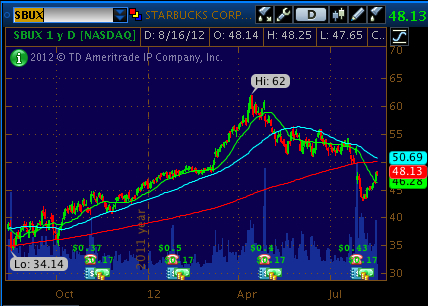
Since it hit a 52 week high of $62 dollars on 4.16.12, SBUX has fallen to a recent low of $43.48 on 8.6.12. During SBUX’s descent, the stock broke through (on the downside) its 50 and 200 day moving averages, a bearish sign. Currently, it looks like the 50 day average is going to make a death cross through the 200 day, a bearish signal. However, if SBUX can climb above the 200 day average, this would be very bullish and we would want to consider a long option strategy

At The OptionWiz, we combine fundamental and technical analysis to make investment decisions. Charts are a valuable tool which we rely on to help predict future movements of individual securities and indexes, alike.


Speak Your Mind